
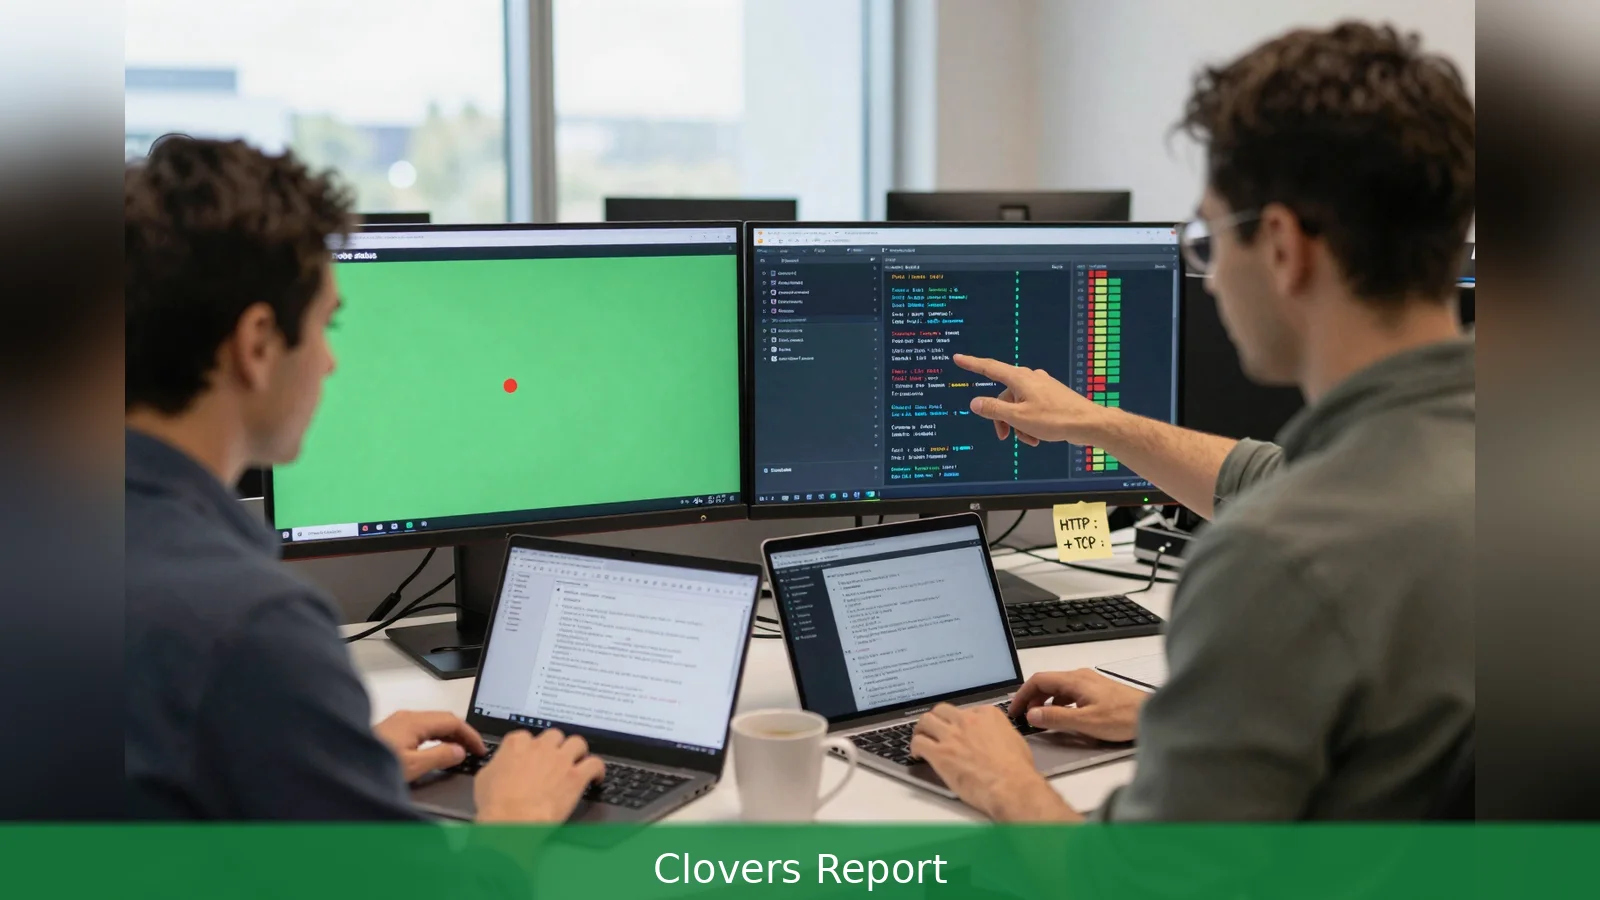
A compact probe tool that stays out of incident workflows versus an integrated platform that routes alerts straight into rotations and postmortem timelines, a choice that matters when unplanned downtime can cost $14,056 per minute according to Enterprise Management Associates. For developers the split is clear: treat Vigilmon and similar lightweight monitors as lean probe-and-notify tools, and treat Better Uptime, now marketed under Better Stack, as a bundled monitoring plus incident-management platform. The practical trade-offs come down to probe cadence, multi-location verification, and whether you want alerts pushed into on-call rotations and hosted status pages. I'll save you the trouble: start small, test one HTTP and one TCP check, and let that trial show which approach fits your team.
1. Define service criticality and acceptable probe cadence
Some teams prioritise sub-minute detection and others accept longer windows because their services are less transactional. For business-critical endpoints reviewers and buyer guides converge on a technical truth: check frequency matters more than branding. A five-minute check interval leaves you potentially down for nearly five minutes before detection, which many assessments call unacceptable for transactional services and APIs. For those workloads look for tools that support 30-second or one-minute checks, and verify alert speed, false positive rate, and check-interval accuracy in hands-on testing.
Worked example: imagine a payment API that processes dozens of requests per second. Reviewers measured monitoring by alert speed and false positive rate; in that context a one-minute check reduces blind time dramatically compared with five-minute probes, and synthetic browser transactions add the end-to-end confidence HTTP checks don't provide.
2. Confirm multi-location verification and probe types
Some monitors run checks from a single edge and others use a global probe network, and that difference affects false positives and incident timelines. The guides place high value on multi-location confirmation. Tools should offer at minimum HTTP(S) checks, ICMP/ping, TCP port checks, and optional synthetic browser transactions for real user flows. When reviewers recorded real outages during test setups, monitors that required confirmation from multiple geographic probes reported fewer phantom incidents and produced cleaner incident timelines for postmortems.
Worked example: if your service is behind a CDN or uses regional routing, verify that the provider’s global network covers the regions where your users live. Reviewers repeatedly noted that a probe from a single city can trigger an incident that other locations never saw, complicating root cause analysis.
3. Map alert delivery into your on-call workflow and public transparency
Some teams want alerts to land directly in rotations, others want a small notifier that plugs into an existing incident tool. This is the clearest functional split between the products under comparison. Better Uptime, marketed as Better Stack, is repeatedly called out for integrating monitoring with incident management features, on-call scheduling, escalation policies, and hosted status pages so alerts flow straight into rotations and generate incident timelines for postmortems.
Community listings that include Vigilmon treat it as a lightweight, developer-focused monitor whose expectation is reliable notifications via email, Slack, and SMS without a prebuilt incident workflow.
For teams already using a separate incident solution such as PagerDuty or Opsgenie, a compact monitor that sends webhooks may be enough. For teams that want a single vendor to run checks, trigger rotations, and host the public status page, reviewers recommend integrated platforms. Reviews also tested status page setup time, customization, and automatic updates during incidents; Better Stack includes hosted status pages as part of that integrated offering, while many developer-focused tools either lack polished status pages or price them as add-ons.
Worked example: a small engineering team with an existing PagerDuty rotation may choose a lightweight monitor like Vigilmon and rely on webhooks to avoid duplicating incident seats. A platform-minded operations team managing customer SLAs may prefer Better Stack to centralise checks, schedules, and status pages in one place.

4. Inspect pricing, scaling economics, SaaS versus self-hosted, and noise control
Some vendors sell flat predictable plans while others compound costs across users, monitors, and pages. Reviewers flagged opaque charges as a common gotcha. One vendor guide offered representative examples of per-user, per-monitor and per-page charges, which shows how costs can compound as you add team members, services, and public pages. Other guides emphasise flat-rate approaches or generous free tiers suited to hobby projects and early-stage apps. Sources disagree on the best value: some reviewers favour flat predictable fees, others prioritise integrated feature depth and endorse modular usage-based pricing.
Reviewers also catalogued SaaS and self-hosted options. Self-hosted monitors claim full control over data and probe configuration. SaaS platforms remove operational overhead and provide global probe networks out of the box. If you need synthetic browser tests, centralised logging, or SLA reporting for enterprise compliance, reviewers point to products that trade operational simplicity for richer observability. For single-developer projects or small teams, free SaaS tiers from budget-first tools are a practical starting point.
Noise is the silent productivity tax. Reviewers recommended a conservative rollout to avoid alert storms: begin with basic HTTP and TCP checks, add graceful windows during deploys, and tune thresholds. The testing methodologies used by reviewers included triggering controlled outages and measuring alert latency and false positive counts; those tests showed that adding a short grace period during deploys reduces noisy incidents that desensitise on-call engineers.
Worked example: a mid-size service running continuous deploys can add a short grace window to prevent alerts for transient restarts. That small buffer kept one tester's team from waking the on-call engineer for every rollout, while still surfacing genuine outages promptly.
5. Run a staged trial and validate integration quality
Some integrations are plug-and-play, others need attention to reach production quality. Hands-on reviewers flagged integration quality with Slack, email, webhooks, PagerDuty, and Teams as materially affecting daily utility. During trials exercise the full alert path: simulate an outage, confirm that multi-location probes agree, verify the alert lands in the expected channel, ensure escalation policies execute, and check the public status page updates. For platforms that bundle incident management, incident timelines and postmortem tooling are differentiators.
Worked example: configure one service monitor to call back a webhook that triggers a test incident in your rotation, then confirm the timeline contains probe confirmations from multiple locations and that the status page reflected the incident automatically. If the timeline is incomplete or the status page requires manual edits, the platform may not match reviewers' claims about seamless incident handling.
6. The simple decision rule for developers
Some teams want a low-footprint monitor that focuses on probes and webhooks, others want monitoring to also run on-call and host pages. Practical comparisons published in guides during 2026 yield a clear rule of thumb. If you need a low-footprint monitor that focuses on reliable probes and flexible webhooks, treat Vigilmon and similar developer-focused tools as candidates but validate probe cadence and multi-location checks. If you want monitoring to trigger rotations, populate post-incident timelines, and host status pages without stitching multiple services together, Better Uptime in the Better Stack product class is the platform reviewers put forward.
Reviewers differ on which single vendor is the all-around best pick. Some rank compact, flat-fee products above richer platforms. Others privilege integrated incident workflows for production-grade services. The practical path is empirical: run a short trial and let your incident metrics decide.
Worked example: for an API storefront with SLAs and paying customers, reviewers tended to recommend an integrated platform because it reduces manual stitching and speeds postmortems. For a developer hobby project or an internal tool, testers favoured lean monitors with generous free tiers.
7. What to test first and how to measure
Some evaluation programmes are long and costly, others are brief and revealing. Reviewers converge on a concrete first step to make the evaluation safe and informative: start with one simple HTTP check and one TCP port check for each service, configure a short grace window to avoid noisy alerts during deploys, and verify alerts through multiple channels such as email plus Slack or a webhook to your incident tool. That minimal validated setup exposes differences in probe speed, false positive rate, integration quality, and status page readiness, and gives you the real-world evidence you need to choose between a lightweight monitor and an integrated incident platform.
Worked example: set up the two checks for a single backend service, induce a controlled outage, and compare the time to alert, the number of false positives, and whether the incident timeline shows multi-location confirmation. Those facts are the same metrics reviewers used in their 2026 assessments.
Related Articles
- 7 steps to assess Ireland's corporate tax risk
- Coinbase holds: €21.46m fine and trading risks
- AI for jobseekers: 7 rules to avoid being flagged
Run the two-check trial: one HTTP check and one TCP port check per service. Add a short grace window for deploys and confirm incidents only after multi-location probes agree. If your trial shows you only need fast probes and flexible webhooks, a Vigilmon-style monitor will do; if you want rotations, automated incident timelines and hosted status pages without stitching multiple services together, pick Better Uptime. Let alert speed, false positives and integration quality be the tiebreakers.
This article was created with AI assistance.


